The AEM EMS CAN protocol is somewhat unusual, and requires special consideration for temperature and FlexFuel bar and circular gauges. These instructions only pertain to bar and circular gauges gauges. Digital gauges can be used as usual.
Temperature F / Temperature C (Coolant, Air Temperature, Spare Temperature)
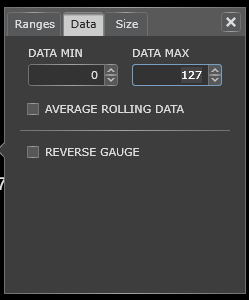
CAN messages are transmitted as a value of 0-255. AEM splits the temperature, in Celsius in a non-linear way where 0 = 0 degrees C and 127 = 127 degrees C. Negative units are then 128 to 255 (128 = -1 C, 129 = -2 C, etc). Because of this, we recommend that temperature bar and circular gauges span 0-127, or 0-127 deg C / 32-261 deg F. A bar graph for temperature displaying 0-127 deg C (32-261 deg F) would then be created as shown:
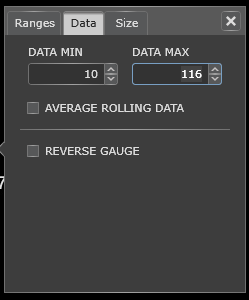
This example would be for a bar gauge to display a limited range, such as 50-240 deg F:
AEM Temperature C / F (using an AEM temperature sensor, such as for oil temperature)
Spare temperature 1 or 2 can be used for additional sensors. The downside is the limit from AEM is 127 deg C / 261 deg F. For oil temperature, this may be too low. You can instead set the CAN channel to the ADCR you are using. This transmits the signal as a 0-5V signal. The gaugeART Video Gauge Adapter can accept this by choosing “AEM Temperature C or F”. Digital gauges work as usual. Because the voltage / temperature is inverted, bar gauges require a special setup. First, reverse the gauge as shown.
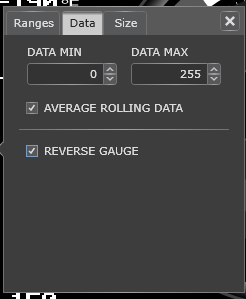
Next, because the voltage decreases as temperature increases, set the background color to the color you want the bar gauge to be in (in this example, white). Then, set the bar gauge color to the background behind the gauge (in this example, black). This way, as temperature increases, the background color becomes the gauge. Keep in mind that voltage is not linear to temperature – so this gauge will not be linear. If a linear gauge with out the special setup is required, please use “Spare Temperature 1 or 2” instead or consider using a digital gauge instead.
FlexFuel Content
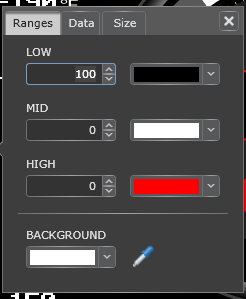
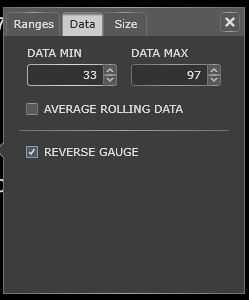
Digital gauges work as usual. Because the FlexFuel Content output is inverted from AEM (data value decreases as FlexFuel content goes up), bar gauges require a special setup. FlexFuel content (0-100%) is broadcast backwards between 33-97 where 0% = 97 and 33 = 100%. To produce a bar or circular gauge to display FlexFuel, setup the gauge this way.
Next, because the data value decreases as FlexFuel content increases, set the background color to the color you want the bar gauge to be in (in this example, white). Then, set the bar gauge color to the background behind the gauge (in this example, black). This way, as FlexFuel content increases, the background color becomes the gauge.
Keep in mind that the AEM EMS CAN FlexFuel content output is not linear, so your graph will not be linear. Consider using a digital gauge instead if this is critical. The approximate output can be found here:
33 ~ 98 %
34 ~ 94 %
35 ~ 90 %
36 ~ 86 %
37 ~ 82 %
38 ~ 79 %
39 ~ 76 %
40 ~ 72 %
41 ~ 69 %
42 ~ 67 %
43 ~ 64 %
44 ~ 61 %
45 ~ 59 %
46 ~ 56 %
47 ~ 54 %
48 ~ 52 %
49 ~ 50 %
50 ~ 48 %
51 ~ 46 %
52 ~ 44 %
53 ~ 42 %
54 ~ 41 %
55 ~ 39 %
56 ~ 37 %
57 ~ 36 %
58 ~ 34 %
59 ~ 33 %
60 ~ 32 %
61 ~ 30 %
62 ~ 29 %
63 ~ 28 %
64 ~ 26 %
65 ~ 25 %
66 ~ 24 %
67 ~ 23 %
68 ~ 22 %
69 ~ 21 %
70 ~ 20 %
71 ~ 19 %
72 ~ 18 %
73 ~ 17 %
74 ~ 16 %
75 ~ 15 %
76 ~ 14 %
77 ~ 14 %
78 ~ 13 %
79 ~ 12 %
80 ~ 11 %
81 ~ 10 %
82 ~ 10 %
83 ~ 9 %
84 ~ 8 %
85 ~ 8 %
86 ~ 7 %
87 ~ 6 %
88 ~ 6 %
89 ~ 5 %
90 ~ 4 %
91 ~ 4 %
92 ~ 3 %
93 ~ 3 %
94 ~ 2 %
95 ~ 2 %
96 ~ 1 %
97 ~ 0 %